11.1 Frequency Response

Contents
Figure 14 shows the typical spectral error in dB-A and dB-C, together with the standard type II limit lines.
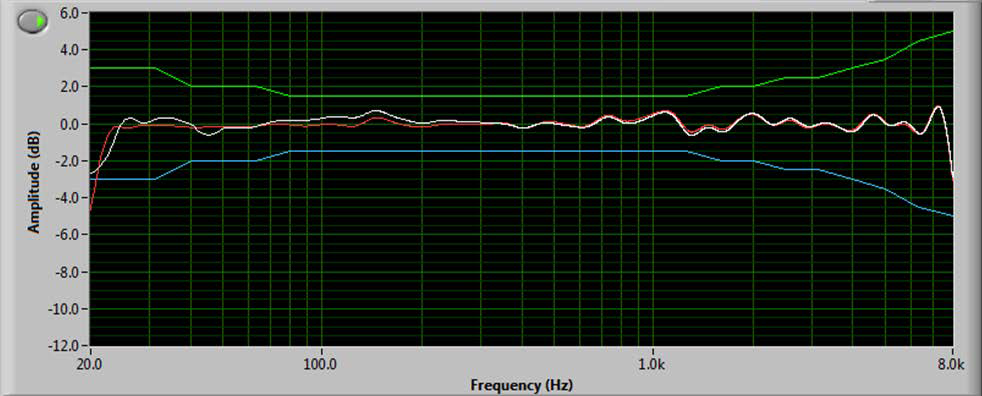
Figure 14
That frequency response is measured at the angle of incidence shown in Figure 15.
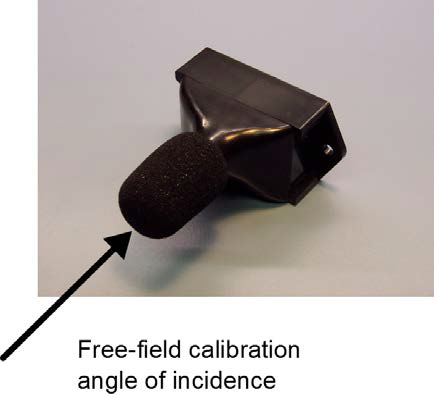
Figure 15
Figure 14 shows the typical spectral error in dB-A and dB-C, together with the standard type II limit lines.
Figure 14
That frequency response is measured at the angle of incidence shown in Figure 15.
Figure 15