6.5.2 Upper Frequency Limit

Contents
Figure 3 shows the response of the accelerometer structure and its acquisition chain, along the X and Y axes, at 4 kHz sampling rate.
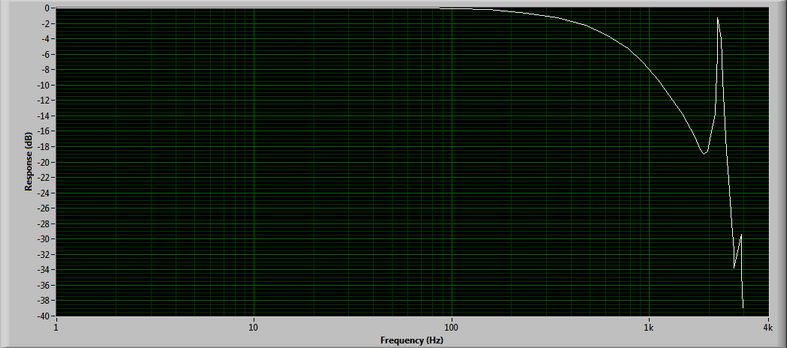
Figure 3 X and Y axes
Figure 4 shows the response of the accelerometer structure and its acquisition chain, along the Z axis, at 4 kHz sampling rate.

Figure 4 Z axis